New virtual climate atlas offers a deep dive into climate change
Geneva, Switzerland - It's a map! It's a simulation! It's your interactive intro to the rabbit hole of climate change scenarios.
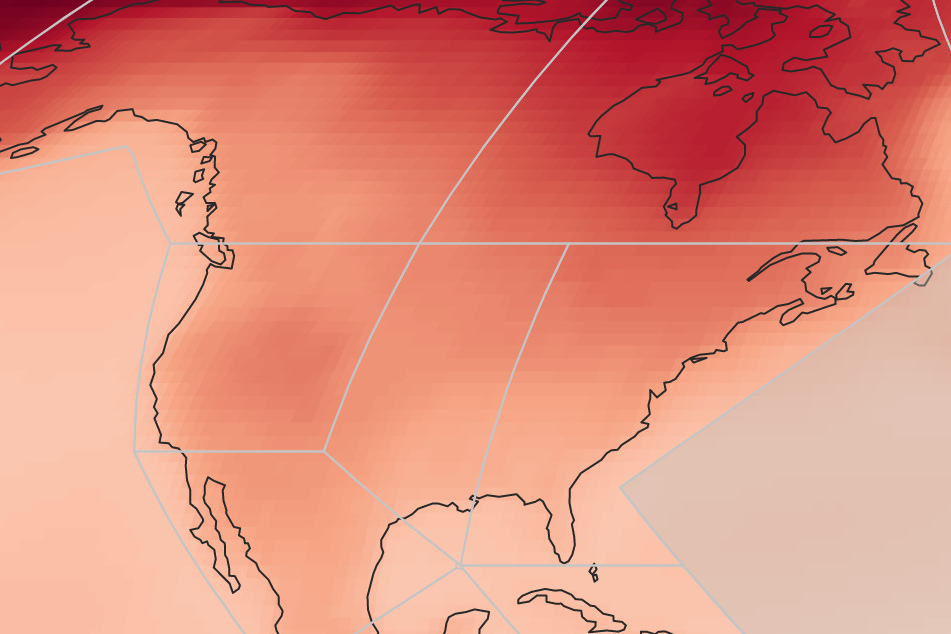
The interactive climate atlas released Monday by the UN's Intergovernmental Panel on Climate Change (IPCC) is all about showing you climate data that you can compare and contrast.
But how do you even drive a climate atlas this detailed?
You can keep it simple and dip your toes into the map's warming waters, or dive into the deep end with different versions that let you tweak more details.

The map features drop-down menus that let you select projections for the hottest and coldest temps, the averages, even rainfall, snowfall, and wind.
Then you can see what weather is coming your way depending on how much the average global temperature goes up.
For even more interactive info goodness, copy the map and compare any info you want.
Looking for a way to plan surviving this winter's cold fronts? Need to know how many days over 95 or over 104 degrees Fahrenheit are coming next summer? Or are you just interested in seeing what climate change looks like on the map? This atlas has got you covered.
The climate atlas and other info from the IPCC helps world leaders and business leaders decide policy, but the climate organization is finally making it easier for everyone else to get informed.
Cover photo: Screenshot/IPCC WGI Interactive Atlas